

Having taught a class on Institutional Instability in 2019 and been a student of higher education for more than 30 years, I have a fascination with how and when colleges may stumble and fall. In addition, I am disappointed that the “system” of higher education is quite opaque when it comes to what institutions are at risk of closing. Part of the reason for this is that we are still learning which factors are most reliable predictors of institutional struggles. For a number of years Forbes has attempted to assess institutional financial instability. I am not sure their relatively complex analysis gets the credit it deserves. For an overview of the 9 factors they use to create these grades and score, see below.

What you will see below are the states and colleges with a failing score on Forbes’ 2024 evaluation of a college’s financial health. “To build Forbes’ annual college financial grades list, they pulled the latest available financial data from the National Center for Education Statistics. In total, they ranked ~1,000 colleges that enrolled at least 500 full-time students. A few folks have not realized that I am not creating this list – I am formatting it to make it easier to read from a regional perspective. But I am literally sharing data from Forbes – you can just as easily get it from them. Here are the grades in a publicly accessible location.
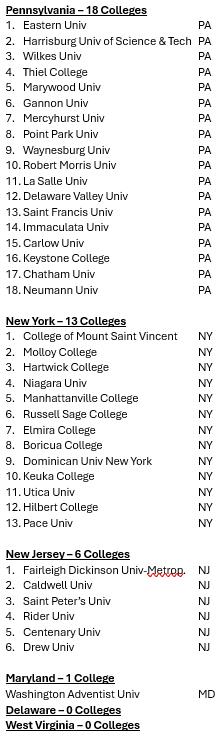
The U.S. Region with the states with the highest numbers of colleges at-risk for closing was the Mid-Atlantic Region. In the nation, Pennsylvania had the most colleges with a failing grade and New York was #2. These are the 38 colleges in the Mid-Atlantic Region that scored the lowest grade possible. Congrats to Delaware, West Virginia, Washington D.C. and Maryland who combined only have 1 college on the list.
The region hit the second most hard is the Great Lakes Region where Michigan, Ohio, and Illinois all have ~10 colleges failing this financial stability test. In total, 34 colleges from this region are on the financially unstable list.


To break up the large region that is the South, there is the Southern Atlantic Region (along the Atlantic Ocean), and the Mississippi Valley Region (along the Miss. river). In this region, there are 23 universities listed, with Tennessee and Missouri leading the way and Louisiana, known for its high rates of poverty, not having any private universities currently failing the Forbes’ test of financial stability.

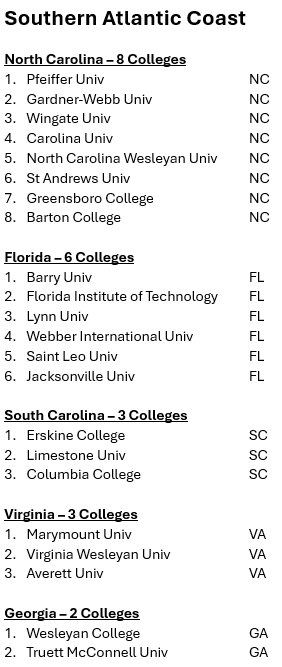
The region just south of the Mid-Atlantic is Southern Atlantic Region – Virginia to Florida, down the coast. North Carolina leads the way in this region for financially unstable colleges, with Florida close behind. There are 22 colleges in total failing this test in the Southern Atlantic Region.
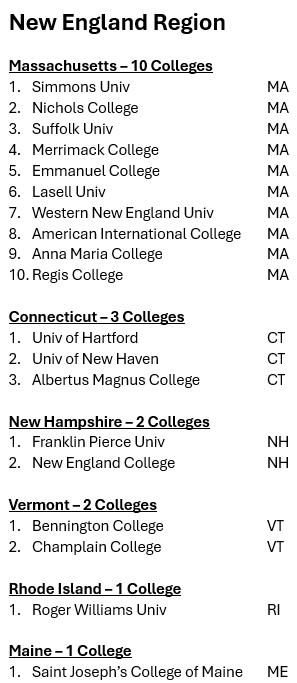
Even though Vermont dominated the college closures list in recent years, Massachusetts is the state with the most colleges on the failing financial stability list in the New England Region. Of course, Massachusetts has the most private colleges per square mile in the nation (I can’t prove that but prove me wrong). Maine and Rhode Island only have 1 college on the list of 19 colleges in financial risk in their region.
The Midwest Region has been described as failing in population numbers and the primary state where this is reflected in colleges at financial risk is Kansas, with 7 colleges with failing grades, including the lowest score in the nation at Sterling College. Iowa has the second most colleges in this list of 18 colleges from this region.

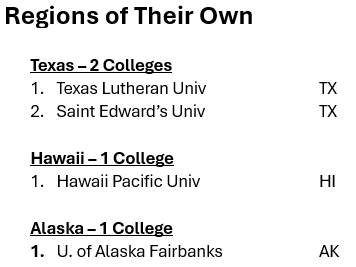
I combined the Rocky Mountain Region (along the Rockies) and the Pacific Coast Region (along the Pacific Ocean) because there were only 12 colleges with failing grades in these 2 regions. It is no surprise that the state with the most colleges would have the most colleges on this list in this region, but only 4 colleges for California seems extremely low when compared to the ~600 colleges in the state.

Having not grown up in Texas, but lived here for 14 years now, I think I can say that Texas defies (refuses to) being placed in any one region. The state is large – Los Angeles is an hour closer to El Paso, TX than El Paso is to the eastern border of Texas. In short, West Texas, East Texas, South Texas, North Texas and Central Texas all seem to be distinct regions!
Methodology
Forbes College Financial Grades are designed to assess a private not-for-profit college’s balance sheet health and operational soundness using the following nine measures. Our data is derived from the Department of Education’s National Center For Educational Statistics. Only schools with more than 500 full-time students were included and public colleges were not graded. Colleges missing more than one of the 19 variables we look at were excluded from our list.
- Endowment Assets Per FTE (15%): This measures schools’ endowment assets at year end per full-time equivalent student. Private colleges generally needed more than $335,000 per student to receive full credit in this category.
- Primary Reserve Ratio (15%): This ratio broadly measures a college’s liquidity, grading how well its expendable assets could meet its annual expenses without straining its normal operations. Expendable assets are defined as total unrestricted net assets; plus temporarily restricted net assets; plus debt related to property, plant and equipment; minus property, plant and equipment net of accumulated depreciation; divided by total annual expenses. Grinnell College in Iowa, which scored an A+ with a primary reserve ratio of 22.6, could cover 22 years of expenses with its existing assets.
- Viability Ratio (10%): This metric analyzes a college’s expendable assets divided by its total liabilities, similar to the primary reserve ratio’s measurement relative to annual expenses.
- Core Operating Margin (10%): This measures whether tuition, donations and investment revenues cover a college’s educational expenses by subtracting its core expenses from its core revenues and dividing the difference by its core revenues.
- Tuition As A Percentage of Core Revenues (15%): Diversified revenue streams make any organization more financially secure, and colleges are no different. Schools that get the lion’s share of their revenue from tuition are more vulnerable to enrollment declines and price competition. Tuition accounts for less than 5% of revenues at 14 colleges, including Yale, Pomona, Caltech, Hillsdale College and College of the Ozarks.
- Return On Assets (10%): This metric divides a college’s change in net assets during the year by its assets at the beginning of the year. Due to a strong stock market in fiscal 2021, full credit was awarded to 266 colleges with at least a 23% return.
- Admissions Yield (10%): Any college would rather be an applicant’s first choice than their safety school. Admissions yield measures the percentage of accepted students who choose to attend, and a higher number is a sign of a healthy enrollment. While top ivy league colleges tend to have yields in the 70% range, any school with a yield of at least 52% received full credit.
- Percent Of Freshmen Getting Grant Aid (7.5%): Colleges that hand out scholarships and grants to a large chunk of their incoming freshmen may be wealthy and generous, but an unusually high percentage in this category is often more indicative of desperation to entice students to enroll. Every school needs well-heeled families paying the full sticker price to boost their coffers. Any college where this is less than 40% receives full credit.
- Instruction Expenses Per FTE (7.5%): This measures how much schools actually spend on educating each student. A higher amount reflects a college able to invest in its core purpose. For the second year in a row, Washington University in St. Louis wins top honors with nearly $150,000 spent per student, with Stanford coming in second at $124,000 per student.

I recently graduated from Averett University and the administration acted like it was going out of business any day! They have cut services to the bone and the employees were all looking for employment elsewhere. I am glad that I graduated, but sorry that I attended in the first place. A degree is worth less if the granting institution is defunct.
LikeLike
George,
Sounds like the beginning of a powerful story. If you take some time to write about what your experience was like there and how the financial situation impacted your education, I think I can help you get it published if you are interested. Thanks for engaging with me and this article – your voice is important and I hope others learn from you!
Jeff
LikeLike
Thanks for posting this. Surely a tragedy for many students, faculty, staff, and others affiliated with the failing institutions. The data are for a single year, but is there a trend?
We need some indication of size and quality of these institutions to judge how much of a disaster this represents at the national level.
Also, I was surprised to see a number of colleges that by name look to be church related, so some indication of sources and amounts of support, in addition to the proportion paid by tuition, would be welcome. Do any of them (e.g., Bennington) have substantial endowments, and could/should anything be saved by pooling resources?
The detailed analysis of this phenomenon, beyond Forbes, would make an interesting and useful project, possibly for one of those who recently joined the list of unemployed, formerly from the US Department of Education.
LikeLike
Peter,
Thanks for engaging on the topic and for offering your thoughtful analysis of longitudinal trends in addition to your observation of church-related colleges. I would suggest you explore Gary Stocker’s College Viability website (https://collegeviability.com/). In his retirement, Gary uses robust data to provide comprehensive analyses of all types of colleges their long-term stability. In addition, Matt Hendricks is running a College Financial Health Show on Youtube that might also interest you (https://www.youtube.com/playlist?list=PLP2kJ_dtKuJLEynl-tBHCvkb8e6wkvDSz). If you find good sources of information, I would enjoy seeing what you find.
Jeff
LikeLike
Your rankings seem a little misleading. It looks like you are giving the school with the highest financial score as first but a lot of people may interpret this as they are most likely to fail.
For example here are the 4 highest D scores
Anderson University,IN,1.435,DSimmons University,MA,1.43,DMidAmerica Nazarene University,KS,1.43,DFaulkner University,AL,1.43,D
Where the number 2 score is
Bethel University,IN,1.223,DNichols College,MA,1.357,DBaker University,KS,1.394,DSpring Hill College,AL,1.259,D
A higher score means better financial health. So if anything the numbers at the top of the list are in better shape than the numbers at the bottom. How much? Well you need to check the numbers to be sure.
I feel like including the information as images is a sketchy move too. Is this to avoid a copyright takedown or for some other reason?!
LikeLike
Nate,
The rankings you are referring to are not mine. You are reading someone’s post on a Reddit channel where the Forbes article is discussed. I reframed the results and shared them without the numbers you refer to because I also found them confusing. I shared my information in images because I am more comfortable creating lists and tables in Word and Excel than I am in WordPress. If Forbes asked me not to share the data, I would immediately take it down. That said, I am giving them positive attention and encouraging people to read their content and understand their rankings which I think is beneficial to them.
LikeLike
Thanks for the response. I think the formatting was not quite as I would have liked in my original reply. Hopefully this is better. Would you mind sharing the reddit post your are referring to?
My biggest concern is the numerical ranks organized regionally by you are a misleading representation of the forbes ranks.
For example in Indiana you list number 1 and two as the following.
Note the score is lower for number 2 than number 1. This means that the number 1 scores are of higher financial health according to Forbes but this list makes it seem like they are more likely to close.
I tried a few others to see. If this pattern persists. MA:
KS:
AL:
I would think a lot of these schools who are listed as number 1 would not appreciate your post making it seem like they are the most likely to close in their state when if fact they have better Forbes score than those ranked lower than them.
There are some remedies on your organization of information:
LikeLike
Nate,
I’m sorry for the confusion. When I mentioned a Reddit post I should have said a chat forum called College Confidential (which I remembered as ~Reddit). You have been on the link because you are referencing it in your comments. https://talk.collegeconfidential.com/t/forbes-2024-financial-grades/3672040/4
My point is that my piece strips out the scores you are mentioning, because I also found them confusing. The link you are referring to was posted by someone other than me – someone titled “randommom1 Parent HS Class of 2025“. I think your feedback might be better focused on her or Forbes.
My goal was to simplify the findings of Forbes into groups of colleges with particularly low “grades.” The level of detail found in the Forbes’ (and randommom’s) articles/posts can lead us to think that predicting college closures is a science. The reality is that is more of an art which is informed by science. Feel free to email if you prefer to discuss offline or we can schedule a phone/video chat. I love that are interested in this topic and that you want to help people best understand this issue!
LikeLike
Is St. Francis College located in Brooklyn New York at risk of closing in 2025.
Anthony Titone
ajtpa@bellsouth.net
LikeLike