

The explosion of access to data in recent years has revealed all types of interesting information. I have always been interested in knowing why certain institutions select the institutional peers to which they most want to compare themselves. This decision becomes important in the non-profit world because value is not as easily demonstrated in profits. For example, do we evaluate universities best based on 1) their size, 2) price, 3) athletics, 4) graduation rates, 5) endowments, 6) mission, 7) academic programs, 8) research production, 9) quality of teaching, 10) admissions selectivity, 11) university rankings, etc.? The measures of success in universities are so numerous that what often happens is that colleges decide to focus on their relative place among a group of peer institutions versus some supposedly objective measures which can vary in importance to different audiences. For example, Brown University can focus on many institutional outcomes but ultimately, if they don’t do what it takes to be favorably compared to their Ivy League peers, their reputation will suffer.
This brings us to the new data now at our fingertips more than ever thanks to publications like the Chronicle of Higher Education. The Chronicle has incorporated some fascinating data visualizations to display the names of colleges that select each other as peers in their annual submission of institutional data to the Department of Education. Colleges are not required to identify their peer institutions, but if they do so, they are provided with a comparative analysis of their peers on their submitted data.
One question we might ask is who, at each institution, is deciding what institutions to name as peers when their annual data is submitted. The data almost always comes from the institutional research offices but this does not mean the identification of peer institutions is made within these offices alone. It could be a strategic decision made by the president or provost. It could be meaningless task delegated to an entry level staff member just focused on compliance. We won’t know the reasons unless we contact the institution and ask them how they select their peer institutions.

What we can do, is use the Chronicle’s data visualization tool to quickly and easily identify some interesting comparisons with regards to what universities are saying when it comes to who their peers are. Before we do that, let’s examine a few of the frameworks that guide the selection of peer institutions.
Frameworks for Selecting Peer Institutions
1. Academic Peers
What elite academic organizations are colleges’ members of? One of the most elite is the AAU, a group of the 63 most elite research universities in the U.S. The prestige of being an AAU member is often sought by colleges and only rarely rewarded as the University of Utah, Dartmouth, and the U. of California Santa Cruz became the first new AAU members in seven years in 2019.
2. Athletic Peers
What athletic conference are colleges located within and how much money does that conference provide them each year? In the past decade, the most generous per-institution conferences have been the SEC and the Big 10 so the U. of Texas’ and the U. of Oklahoma’s efforts to join the SEC and UCLA’s and USC’s joining of the Big 10 will bring these four universities additional revenue and added prestige. Interestingly, for those of you novices in the understanding of athletic conferences, the major conferences are centered almost entirely around the competitive nature of the college football team.
3. Similar Wealth Peers
This criterium is based on which colleges have the largest among of endowment (saved money for investing) in total and/or per student. This status grouping is why some colleges intentionally stay small in size so that they are financially secure for not just 10 years in to the future, but 50 years or more. It shouldn’t surprise us to see that Harvard, Yale, Stanford, MIT, and Princeton lead this list of colleges, but it may surprise you to know that Pomona, Amherst, Williams, Grinnell and Swarthmore are also a part of the most wealthy colleges with access to over $2M per student in savings.
4. Institutional Mission Peers
In world of where everyone trying to demonstrate their uniqueness, the reality is that most colleges have more in common with each other than ever before. Federal expectations for accountability, accreditation pressures for quality, and competitive pressures to maintain pace with peers has resulted in a reduction of institutional differentiation, in spite of the supposedly competitive advantages of this. However, some universities have found that highlighting their unique missions can be helpful. Some of the many examples of mission groupings include: 1) public land-grant colleges, 2) Catholic universities, 3) Hispanic Serving Institutions, 4) research universities, 5) women’s colleges, 6) the Council for Christian Colleges and Universities (CCCU), 7) Historically Black Colleges & Universities, etc.

5. Application Peers
At the end of the day, colleges will not be successful if they cannot beat out the colleges that they compete with the most for prospective students. This sort of data is typically collected on students’ college applications when they identify what other colleges to which they are applying. Admission peers are often strongly correlated to geographic regions except in the cases the most elite universities. For example, Baylor University would not be successful if it had not learned to compete against the U. of Texas and Texas A&M, the two universities that cross college applications the most with Baylor. Both of these over-50,000 student public universities are within 2 hours of Waco and tout sticker prices around half of what Baylor charges along with having massive alumni bases in the state. Baylor’s private pricing model must, and often does, win over Texans looking at these top 2 Texas public universities.
Other peer institution groupings can include those based on institutional size, graduation rates, unique academic fields, percentages of underrepresented minorities, and standardized test scores,
Observations Based on Universities’ Selection of Peers
Before sharing some of my observations, Audrey Williams June published an article in Chronicle (March 2022), that does an excellent summarizing some of the highlights of the peer selections. Several highlights taken from June’s analysis included:
1) Carleton College was the most-commonly selected peer institution. It was chosen by 55 colleges. Kenyon College was selected by 49 institutions as a peer and Oberlin and Allegheny Colleges were selected by 48 other colleges. The average size of an institution’s selected peer group was 18.
2) The U. of Tampa chose 100 peer institutions colleges which was the maximum allowed.
3) Ivy League colleges typically chose each other as peers, although Columbia and Princeton didn’t choose any peers. Forty-six colleges outside the Ivy League chose at least one member of the Ivy League as a peer.
I choose a mix of universities to explore peer selections. The table above lists 25 universities selected for various reasons – many in or near Texas, elite privates, unique missions, and others where I have worked/attended. For simplicities sake, I only listed universities that had 7 or less matched peers. Feel free to select whomever you would like if you want to do comparisons.
For starters, there was a group of universities I looked up that are not in the table below because they did not select any peer institutions. I wouldn’t draw any conclusions from this fact. However, for whatever reason(s), Columbia, Duke, Howard, Princeton, and TCU selected no peer institutions.

Other observations on the table above include:
1) Harvard only sees it itself as a peer to 3 universities – Yale, Princeton, and Stanford.
2) Texas and Texas A&M do not list each other as peers but they each share three peers – Michigan, Purdue, and Wisconsin. Why might this be?
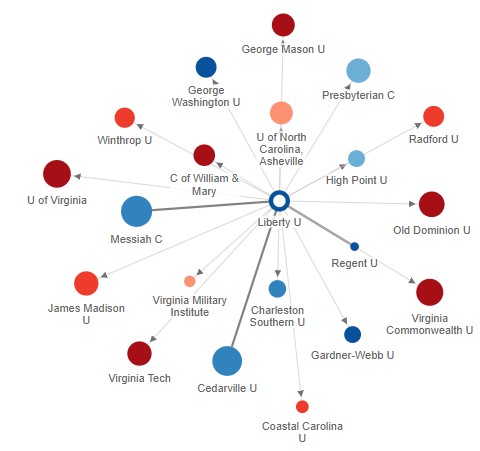
3) Liberty selected peers with enrollments, on average, 20% of Liberty’s student enrollment size while Rice selected peers, on average, twice Rice’s enrollment size. Liberty was the only institution in the table peer to select peer institutions from 6 different Carnegie Classifications.
4) I selected Lincoln College because it literally closed down since this data was collected. Evidently, Lincoln identified 10 schools as its peers – does this say anything about these colleges’ stability? What about the one college, Hesston, which identified Lincoln as a peer? Does anyone else find it odd that Lincoln College states it has a 73% admit rate when low enrollment was the final determinant in closing?
5) U. of Phoenix’s selected peers are, on average, 66,000 students less than Phoenix. U. of Phoenix evidently has a 100% admit rate while their peers admit 86% of their applicants.
6) U. of Central Florida, the largest university in the US, has, on average, 17,000 more students than its peers. It also had the largest gap, in this table, for the average selectivity of its peers (66%) being much higher than UCF (45%).

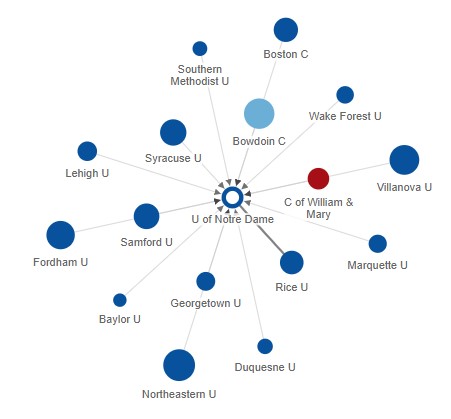
7) Notre Dame identified 26 peers and 16 universities identified Notre Dame as a peer but only one university was on both lists – Rice. In spite of this lack of overlap in peers, the gap in admission selectivity between Notre Dame’s peers and its admission rates was only 6%. The image to the left are the peers Notre Dame chose and the image below are the colleges that selected Notre Dame as a peer.
8) A similar lack of peer overlap occurred at Baylor, which selected 8 peers and had 10 other colleges say they were peers of Baylor and only 1 university was on both lists – SMU. Baylor selected peers that admitted almost half as many new students (36%) as Baylor admits (68%).
9) Oregon was the only other university on this list with a larger positive gap between their admissions rate and the identified peers. I wonder why it is that Oregon (and Baylor) are selecting peers with such widely different admission rates than the colleges calling them peers?
10) Eastern Mennonite (where I worked in 1990s) and U. of Maryland Eastern Shore (where my father worked for 30 years) also both only overlapped with one peer each, but in their situations, the peers they selected were, in general, less selective than these two schools (thus the negative percentages). Why are these two schools selecting peers with less admissions selectivity than they have (UCF did the same)?
