

Part 1 of this article, The Unintended Consequences of Campus Crime Data, is also available.
What’s Your Favorite Cheerios?
If you had to choose between liberty and freedom versus constraint and paternalism, which would you select? Almost everyone selects the former. Our nation was founded on liberty, fleeing the paternalism of England. Employees are motivated by autonomy, and discouraged by micromanagement. But is there a limit to the freedom we need to be happy?
Believe it or not, research has consistently shown that by giving people complete freedom to make whatever choice they deem best results in less happiness, greater anxiety, and less actual decision-making. And yet, as Barry Schwartz and others have shown, we rarely have any idea how much the variety of choices available to us exhausts our mental capacities and makes it more likely that we will choose nothing because we are so overwhelmed. One of best examples of this was a study on the display of jams for sale at a grocery store. When the display had 24 flavor options, 3% if the customers bought the jam. However, when the options were limited to six flavors, 30% of the customers bought jam.

This, of course, does not mean that freedom of choice is bad – just that there is a limit to how much it helps before it starts to freeze us with indecision. Do you remember when there was only one type of Cheerios? For 35 years this was the case. When I was growing up, we were so excited to be introduced to Honey-Nut Cheerios (1979) and Apple-Cinnamon Cheerios (1988). Today there over 40 Cheerios flavors – an overwhelming assortment of choices that leaves me buying an old favorite – Grape Nuts (which have no grapes nor nuts).
Clery Act Cognitive Overload
It was this concept of choice overload which was gnawing at me as I tried to find helpful information related to the Clery Act. It began when I learned that the 1990 Clery Act (originally called the Campus Security Act) consisted of just over 300 words. By 2005, this guidance had grown to over 200 pages and in 2016 it was over 256 pages! Can you imagine being the campus security officer in charge of reading and following this federal guidance? You would have to read basically an entire book to complete the report.
Next, I tried to see how difficult it would be to find the data tool, previously mentioned, to compare universities’ crime data. I started at the Department of Education’s website, where you would find no mention of this data. If you correctly guessed to click on the menu item titled “Laws” and then scrolled down over 30 lines of information, you would see a link called, “Postsecondary Policy Initiatives.” If you were fortunate enough to find and click on this link, you would arrive at a page where if you scrolled down about 40 lines of text, you would find a link called, “Campus Security & Safety. Clicking on this link brings you to another site with many links but one of the links is called “Data on Campus Crime.” On this site, with one final click, you can compare up to four college’s campus crime data (so get the data on the 16 schools listed above, I had to conduct four separate searches.)

I am thankful that this campus crime data comparison tool exists but realistically, I fear not many people will know about it. Thus, I began a journey to not only find colleges’ campus crime reports on their websites, but also locate their crime data within these reports. Since I had selected large, public, universities in the previous article, this time I used College Navigator to select the 15 largest private undergraduate universities that had some residential students. It is worth noting that even though the Campus Security Act was renamed the Clery Act in 1998, the actual report on universities’ websites is supposed to be referred to as the Annual Campus Security Report (which is not always the case).
A Wide Range of Results
As you review the table below, note the length of the Security Reports. The shortest report is Cornell University at 32 pages, while the longest is Boston University, at 196 pages. This is a range of 164 pages with a percentage increase between Cornell and Boston of over 600%. Maybe someone can provide the logic as to why an Ivy League institution such as Cornell U, can communicate federally required safety data in 1/6th of the pages that another top 50 university, Boston U (#42), can do.

Outside of these 15 institutions, I found one college, Prairie View A&M, has a crime report just shy of 300 pages. Prairie View A&M is a historically black college and located in a town of about 6,000 residents. Just 50 miles southeast of Prairie View, is another historically black college, in the heart of Houston, called Texas Southern, which has only a 52 page security report. Again, a massive difference in approach to documenting this federally required data.
The placement of the actual crime statistics within the reports was also quite variable. BYU Provo lists their crime data on page nine of a 125-page report – within the first 7% of the report. Their sister school, BYU Idaho, and actually larger the BYU Provo, provides a security report in less than half of the pages (61 pages) and lists their crime data almost two-thirds (64%) into the report. How could two universities, so similar, differ so dramatically in how they document compliance to the Clery Act? In another example, in the 196-page Campus Security Report for Boston University, plan on reading until page 174 (89% into the report) before finding the actual crime statistics. These large differences of report length and placement of the crime data reveals the large range of interpretations currently possible by universities.
When I asked one university’s Clery Officer about the relative placement of the crime data, their response demonstrated wise insight.
“How easy or difficult it is to find the Clery statistic charts within an Annual Campus Security Report, is left up to the author of the report. One could easily argue that most reports keep this information in the back, not to hide it, but because we realize it isn’t where the focus of the reader should be due to its lack of accuracy.”
One could easily argue that most reports keep this information in the back, not to hide it, but because we realize it isn’t where the focus of the reader should be due to its lack of accuracy.”
In other words, universities may know that their data is not representative of the actual crime on campus so they tuck it away to focus on what they consider more important aspects of the Security Report. This seems actually like a good idea based on the conclusions from “The Unintended Consequences of Campus Crime Reporting.”
The disparate page lengths the Campus Security reports was not just among institutions, but also within them. For example, Rochester Institute of Technology’s 2020 Security Report was 110 pages long, but in 2021, it was shortened to 48 pages. This means that 56% of the report disappeared in a year. What 62 pages of content did they remove from 2020 to 2021? Syracuse’s Annual Security Report also shrunk from 110 pages in 2020 to 67 pages in 2021. In addition, Syracuse’s reporting of their crime data shifted a third nearer to the front of their report.
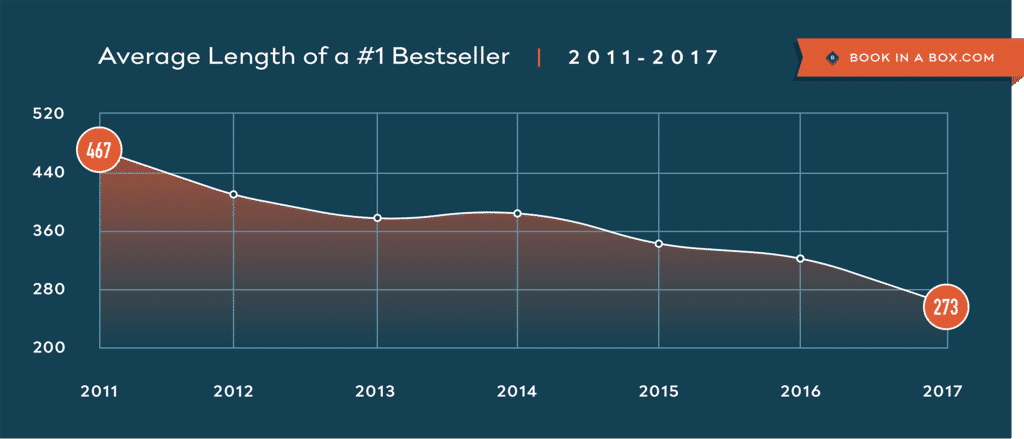
Before concluding all Security Reports are going down in length, note that St. John’s U. (NY) expanded their report from 110 to 184 pages and the U. of Southern California also increased the length of their report from 139 to 160 pages. Can you imagine any prospective student or a parent reading an Annual Campus Safety Report of over 150 pages? The average length of best-selling books has dropped almost 50% in recent years, but the Annual Campus Safety Reports seem to going in the opposite direction.
The last two columns of the table below answer the question of what is more important, legal compliance or student/family information. In studying ten of the institutions’ home pages for both parents/families and students, at least half of these websites had no easily discernable link to the Annual Security Report. For those that did have a link, it often required multiple clicks to get to the report or the reports were found under website footers with headings such as Consumer Reports or Legal Disclosures. In short, colleges are complying with the law but not exactly making their Annual Campus Security Reports easy to find. That being said, universities are required to email all students these reports once a year and they are all present somewhere on each university’s website.
| University | Page where Crime Data Starts | Percentage into Report When Data Appears | On Parents’/Families’ Homepage | On Current Students’ Homepage | |
| 1 | Baylor U | pg. 10 of 76 | 13% | Yes, at footer – 2 clicks off of Legal Disclosures link | Yes, Safety link |
| 2 | Boston U | pg. 174 of 196 | 89% | No Nor under Parent Resources | No Nor under Student Safety |
| 3 | Brigham Young Idaho | pg. 39 of 61 | 64% | No, Not among >90 links | No |
| 4 | Brigham Young Provo | pg. 9 of 125 | 7% | No, a Safety link does not help | Not one Students site |
| 5 | Cornell U | pg. 8 of 32 | 25% | No, nor under Family Resources | No, not even under Student Safety |
| 6 | DePaul U | pg. 12 of 76 | 16% | Yes, 4 clicks off Consumer Reports link | Yes, Student Services, then Public Safety |
| 7 | Drexel U | pg. 75 of 92 | 82% | Yes, 3 clicks off Crisis Help | Yes, 3 clicks off Crisis Help |
| 8 | George Washington U | pg. 22 of 103 | 21% | Yes, 2 clicks off Safety & Security | No |
| 9 | Liberty U | pg. 32 of 42 | 76% | No, nor under Safety & Support link | No, nor on the Student Safety brochure |
| 10 | New York U | pg. 24 of 92 | 26% | Yes, 3 clicks off of Resources | No |
| 11 | Northeastern U | pg. 100 of 113 | 88% | ||
| 12 | Rochester Inst. of Technology | pg. 32 of 48 | 67% | ||
| 13 | St. John’s U (NY) | pg. 55 of 184 | 30% | ||
| 14 | Syracuse U | pg. 24 of 67 | 36% | ||
| 15 | U of Southern California | pg. 98 of 160 | 61% |
Did I Say the Clery Act was Created to Help with Comparisons?
…the creation of the Clery Act was intended to allow for campus crime comparisons among institutions. However, one professor and sexual assault researcher states that Clery data should not be used as a tool for comparing institutions
Remember that the creation of the Clery Act was intended to allow for campus crime comparisons among institutions. However, Mary P. Koss, a professor of public health at the University of Arizona and a sexual assault researcher, states that Clery data should not be used as a tool for comparing institutions:
“In some respects, high numbers can be good. If you’re revamping your approach to sexual assault, you would actually expect the number of reports to go up. But even those high rates are not credible, as they are just the number of reports, not actual assaults. The bigger story is looking at those numbers in the context of how many rapes are being identified by climate surveys.”
Her quote indicates that any comparison of the Clery data is fraught with errors and we should be instead focusing on campus climate assessments.
The Dean of the School of Education at Union University, John Foubert, who founded a national sexual assault prevention group further downgrades the value of Clery data:
“The only use I see for it is to gauge how far an institution needs to go in closing the gap between reported rape and the actual rate, which needs to be determined by anonymous surveys.”
In support of both Koss’ and Foubert’s points, the results of an AAU survey showed that the U. of Oregon reported six rapes in 2014. However, a national survey of Oregon students that same year found that more than 500 students said they had experienced attempted or actual rape. This suggests there might have been several hundred unreported cases of rape at the U. of Oregon in 2014.
U. of Oregon reported six rapes in 2014. However, a national survey of Oregon students that same year found that more than 500 students said they had experienced attempted or actual rape.
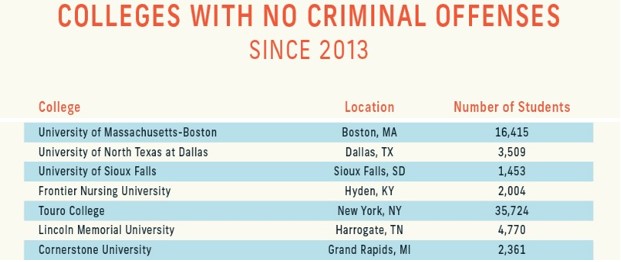
There is one company, CheckVideo, which sells a video security solution for colleges, that has a website pulling college crime data to announce that the colleges below are some of the safest in the U.S. since they have no/zero/zilch crime reports over at least 4 years. Anyone want to bet on the reality of this?
They Meant Well
Back in 1989, the reason the Clery’s fought to implement the Campus Security Act was that the university had ‘a rapidly escalating crime rate, which they didn’t tell anybody about.’” The Clerys argued that felons were living on campus, although their daughter’s assaulter was an off-campus student, who had worked in the campus housing office and had no criminal record. No matter the catalyst, universities have now been publicly sharing campus crime data for over 30 years. I am confident that much good has come from the efforts of the Clery’s and many others to help universities face the fact that they were not consistently reporting campus crime. At the same time, I don’t understand how requiring universities to collect campus crime data that is not likely accurate or easy to compare helps.
Many universities employ at least one, if not more, full-time staff responsible for collecting data for and communicating the Annual Campus Security Report. This staffing cost plus other related resource costs (e.g. graphic design) suggests that millions of dollars are being spent by universities on compliance with a federal law that results in data which is:
1) difficult to find,
2) rarely, if ever, used to compare colleges,
3) can be interpreted in a myriad of ways, and
4) is not the accepted best practice for estimating campus sexual crimes.
Let me make it clear – I am not blaming anyone. I am making an observation about what the unintended consequences of two caring parents has resulted in 30 years later. As one Clery Compliance Officer put it,
“I couldn’t agree more that the Clery Act has surpassed and become far more nuanced and complex than the simplistic intent of consumer transparency the Clery’s sought when this began.”
Where We Should Not Go From Here
The Clery Act, however, is more than crime data. There is an abundance of information in the Annual Campus Security Report that is reliable and should not be forgotten. For example, within it we can see most of a university’s policies related to campus safety in one location, in addition to their safety education and crime prevention programs, their reporting processes, and their process for violations of their policies.
Instead of “throwing out the baby with the bath water,” and eliminating the Annual Campus Security Report, I would refocus its attention on the more relevant and accurate campus security information worth sharing. Some of this valuable information includes 1) Timely Warnings – notices sent to warn of serious and ongoing threats, 2) Emergency Notifications – notices informing of situations creating an immediate danger, and 3) a Daily Crime Log – a log of crimes not only on owned and controlled properties but also those in the patrol jurisdiction.
As one Clery-focused staff person shared with me, the report
“promotes positive accountability towards campus safety and create unclouded consumer protection and transparency. People need the regulation and accountability the Clery Act demands. Policies have much more robust elements they would not otherwise.

Having universities complete an Annual Campus Security Report still has value, but I believe it is time to reexamine the challenges and pitfalls that come with sharing data that are probably not accurate and lead to widely divergent conclusions. Part 1 of this article, The Unintended Consequences of Campus Crime Data, is also available.
